Shareholder
The Group continued to deliver on its shareholder commitments, despite a multitude of challenges stemming from the operating environment. Performance during the year attests to the diversity and resilience of the Group’s earnings profile and its strategic agenda which has positioned the Group for transformational growth. During the year Hayleys delivered a record-breaking Revenue, strong growth in profit generation and impressive shareholder metrics.
Key shareholder metrics
Our Approach to Reporting
As the primary annual communication to capital providers and other stakeholders, the Group’s Integrated Annual Report provides an overview of the Group’s performance and strategic progress for the year and outlook for the future. Key features of this year’s Annual Report include the following:
Leadership and Governance

Mohan Pandithage
Chairman and Chief ExecutiveReflections from Chairman & Chief Executive
“The Group’s performance during the year serves as a clear testament to the strength of its diversified market presence and customer base, which enabled resilience amid an evolving and often unpredictable operating environment”
Download Reflections from Chairman & Chief ExecutiveYou may like
Corporate Governance
The Group’s fit-for-purpose governance frameworks ensure compliance with applicable laws, codes and best practices through effective and adequate controls. The Board ensures that Hayleys is governed through ethical consciousness and integrity thereby preserving the interests of diverse stakeholders and capital resources while guaranteeing accountability and effective leadership
Key highlights in 2024/25
- Change in Board composition- Majority of Directors are Non-Executive, while majority of Non-Executive Directors are Independent
- Appointment of new Directors
- Several policies refreshed and updated in line with the requirements of the new listing rules
- Full compliance to new Listing Rules
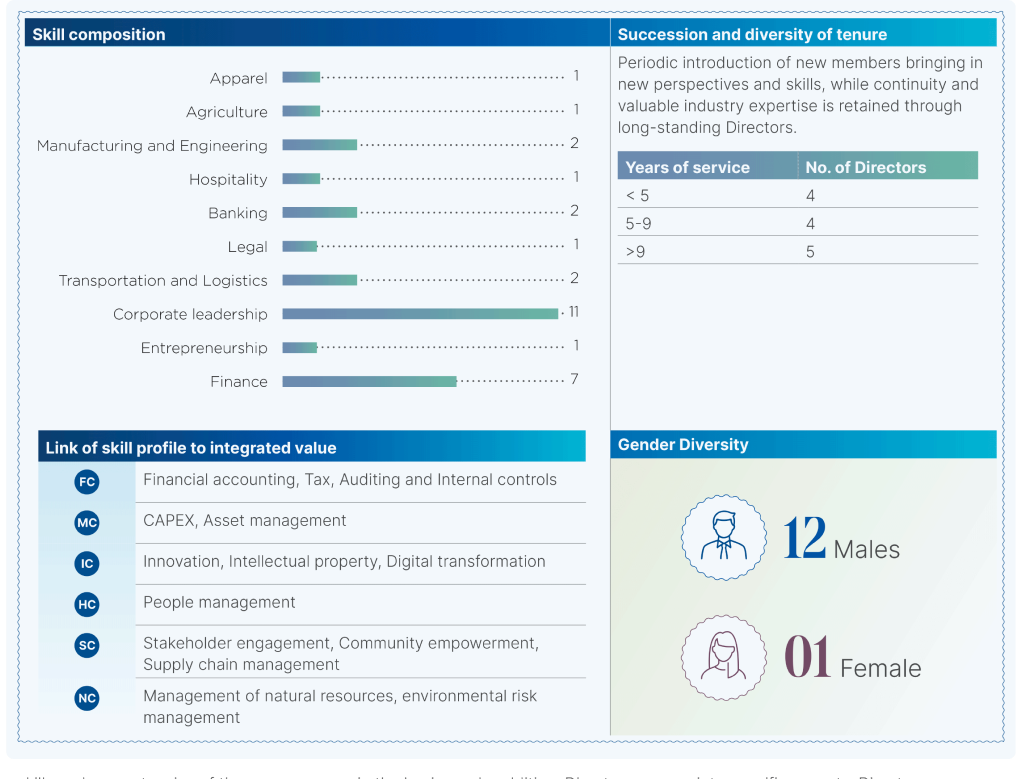
Board skills and capabilities

Board focus areas in 2024/25
Purpose driven Strategy
The Group’s strategy is underpinned by five pillars, formulated by the Strategic Business Development Unit (SBDU) at Hayleys PLC and cascaded to each Sector under the leadership of the Group Management Committee.
- 1Expansion of geographical footprint
- 2Enhancing manufacturing capabilities
- 3Diversification of customer base
- 4Cost management and process automation
- 1Value-added product development
- 2Fulfilling customer requirements on sustainability
- 3Strengthen after-sales service in key verticals
- 4Enhance customer engagement through social media platforms
- 1Implementation of systematic succession plans
- 2Group-wide diversity, equity and inclusion training
- 3Leadership development programmes
- 4Employee engagement
- 1Capacity building across supply chains across key verticals
- 2Strengthened Group Procurement policy
- 3Backward integration and supply chain diversification
- 4Strategic community development initiatives
- 12nd edition of Hayleys Lifecode launched
- 2Sector-level ESG Roadmaps launched by 2 Sectors
- 3Widened computation of Scope 3 GHG emission
- 4Quarterly reporting of ESG metrics

Financial capital
Despite a multitude of challenges that prevailed during the year, the Group demonstrated strong resilience to achieve its highest ever Revenue and strong profitability. The Group remain focused on driving enhanced shareholder value through organic and inorganic growth in the portfolio, operating efficiency and effective margin management.
Consolidated Revenue
13% increase to
Rs.492.20 bn- Revenue growth driven by strong contributions from Consumer & Retail and Transportation & Logistics sectors
- Growth in the domestic businesses countered the adverse implications of the appreciation in the exchange rate which impacted the export-oriented sectors
Earnings Before Interest & Tax
12% increase to
Rs.47.77 bn- Driven by improved profitability in Consumer & Retail and Transportation & Logistics sectors
- Notably the Leisure Sector which had incurred a Loss Before Interest and Tax recorded strong turnaround at EBIT level.
Profit Before Tax
40% increase to
Rs.35.37 bn- The Consumer & Retail was the largest contributor to PBT with a share of 15%, followed closely Transportation & Logistics (15%), Purification (13%), Hand Protection (9%), Textiles (7%) and Projects & Engineering (8%)
Total Assets
16% increase to
Rs.510.69 bn- Asset growth was supported by investments across several key sectors including Transportation & Logistics, Purification, Hand Protection, Textiles and Construction Materials
- Current asset growth of 14% driven by an increase in Trade & Other Receivables
Borrowings
19% increase to
Rs.204.41 bn- Debt profile is dominated by Consumer & Retail, Transportation & Logistics and Others Sector
- Borrowings funded 40% of the Group’s Total Assets
Indicator
Movement
13% increase to
Rs.492.20 bnCommentary
- Revenue growth driven by strong contributions from Consumer & Retail and Transportation & Logistics sectors
- Growth in the domestic businesses countered the adverse implications of the appreciation in the exchange rate which impacted the export-oriented sectors
Movement
12% increase to
Rs.47.77 bnCommentary
- Driven by improved profitability in Consumer & Retail and Transportation & Logistics sectors
- Notably the Leisure Sector which had incurred a Loss Before Interest and Tax recorded strong turnaround at EBIT level.
Movement
40% increase to
Rs.35.37 bnCommentary
- The Consumer & Retail was the largest contributor to PBT with a share of 15%, followed closely Transportation & Logistics (15%), Purification (13%), Hand Protection (9%), Textiles (7%) and Projects & Engineering (8%)
Movement
16% increase to
Rs.510.69 bnCommentary
- Asset growth was supported by investments across several key sectors including Transportation & Logistics, Purification, Hand Protection, Textiles and Construction Materials
- Current asset growth of 14% driven by an increase in Trade & Other Receivables
Movement
19% increase to
Rs.204.41 bnCommentary
- Debt profile is dominated by Consumer & Retail, Transportation & Logistics and Others Sector
- Borrowings funded 40% of the Group’s Total Assets
Portfolio Reviews
Eco Solutions
Download Sector ReportRevenue (Rs. bn)
12.85PBT (Rs. mn)
(524)PAT (Rs. mn)
(520)Assets (Rs. bn)
20.76- Performance impacted by appreciation in Sri Lankan Rupee and escalation in raw material costs, which led to a reduction in Revenue and implications on margins
- Investments in backward integration through investments in a fibre-extraction facility
- Continued investments in value-added products
Hand Protection
Download Sector ReportRevenue (Rs. bn)
46.35PBT (Rs. mn)
3.86PAT (Rs. mn)
3.26Assets (Rs. bn)
42.04- Resilient performance backed up volume growth and penetration in new and existing markets
- Expansion of manufacturing footprint with the acquisition of Hi-Care Thai Gloves Co., Ltd and manufacturing expansion of Hanwella facility
- Strengthening global presence through establishing marketing arms
Purification
Download Sector ReportRevenue (Rs.bn)
42.83PBT (Rs. bn)
5.50PAT (Rs. bn)
4.26Assets (Rs. bn)
42.93- Revenue remained relatively unchanged due to the appreciation of the Sri Lankan Rupee, while Profit Before Tax moderated mainly due to margin contraction from rising coconut-shell charcoal prices in global markets
- The Sector continued to pursue increased contributions from value-added products and geographical expansion
- Strategic emphasis on strengthening supply chain security and resilience through backward integration and diversification of supply chains
Textiles
Download Sector ReportRevenue (Rs. bn)
43.46PBT (Rs. bn)
3.07PAT (Rs. bn)
2.11Assets (Rs. bn)
35.86- Performance impacted by decline in volumes stemming from the deferment of orders from a major customer and appreciation of the Sri Lankan Rupee
- Strategic emphasis on brand diversification with the addition of several exciting, fast-growing brands to the portfolio
- Ongoing focus on transitioning from basic, conventional, cotton-based fabrics to premium, value-added products
Construction Materials
Download Sector ReportRevenue (Rs. bn)
13.11PBT (Rs. bn)
1.14PAT (Rs. mn)
867Assets (Rs. bn)
16.56- Performance upheld by uptick in residential demand and strong growth in export volumes
- Strengthened manufacturing footprint with the commissioning of Ascend- an advanced facility featuring cutting-edge technology and invested in improving technological capabilities
- Successfully obtained the Aluminium Stewardship Initiative (ASI) certification
Plantations
Download Sector ReportRevenue (Rs. bn)
19.18PBT (Rs. bn)
2.91PAT (Rs. bn)
1.91Assets (Rs. bn)
27.28- While Revenue increased led by growth in crops and prices, profitability was impacted by the sharp increase in wages and other costs
- Talawakelle Tea Estates commissioned a state-of-the art tea factory in Kiruwanaganga
- The three RPCs continue to lead the industry in sustainability, innovation and quality, emerging as top price takers in the Colombo Tea Auction.
Agriculture
Download Sector ReportRevenue (Rs. bn)
37.51PBT (Rs. bn)
2.60PAT (Rs. bn)
1.5Assets (Rs. bn)
29.33- The Sector delivered a resilient performance, through leveraging the diversity of its businesses geographical footprint and global partnerships.
- Continued focus on expanding product offering in Bangladesh
- Diversification of business lines with the entry into frozen coconut water
Consumer & Retail
Download Sector ReportRevenue (Rs. bn)
108.48PBT (Rs. bn)
6.53PAT (Rs. bn)
4.39Assets (Rs. bn)
124.47- Singer achieved record-breaking profitability during the year supported by the more conducive market conditions and timely market activations across its network
- Widened the product and brand portfolio while pursuing diversification of customer segments
- Ongoing focus on upgrading showrooms and enhancing the customer experience
Leisure
Download Sector ReportRevenue (Rs. bn)
9.65PBT (Rs. mn)
(521)PAT (Rs. mn)
(627)Assets (Rs. bn)
19.78- Sector’s overall performance was upheld by the record-breaking profitability of the Sri Lankan properties, with all four properties generating profits for the first time. Overall profitability however, continued to be impacted by Amaya Kuda Rah Maldives,
Industry Inputs, Power & Energy
Download Sector ReportRevenue (Rs. bn)
11.10PBT (Rs. bn)
2.16PAT (Rs. bn)
1.71Assets (Rs. bn)
17.05- Sector delivered commendable performance during the year, reflecting improved profitability in both Industry Inputs and Power & Energy clusters
- Secured a tender to construct and operate a 4MW ground-mounted solar project
- Industrial Raw Materials performed well during the year, reflecting increased contributions from value-added products.
Transportation & Logistics
Download Sector ReportRevenue (Rs. bn)
106.84PBT (Rs. bn)
6.51PAT (Rs. bn)
3.72Assets (Rs. bn)
82.42- The Sector recorded significant improvements in Revenue and Profitability supported by more conducive conditions and broad-based improvements across clusters
- Strategic focus on establishing the geo-product organisational structure for focused regional expansion
- Expansion of the marine fleet with the addition of 3 vessels during the year
Projects & Engineering
Download Sector ReportRevenue (Rs. bn)
26.62PBT (Rs. bn)
3.33PAT (Rs. bn)
2.37Assets (Rs.bn)
27.38- The Sector’s overall performance moderated due to the global decline in solar panel prices, although the Sector maintained its leadership position in solar EPC segment
- Secured a contract to develop a 50 MW wind power plant in Mannar, along with 37 ground-mounted solar projects amounting to 149 MWM
- Partnered with BYD, the global leader in Battery Energy Storage systems, to launch advanced energy storage and inverter solutions in Sri Lanka
Tea Exports
Download Sector ReportRevenue (Rs.bn)
13.16PBT (Rs. mn)
616PAT (Rs.mn)
468Assets (Rs.bn)
5.59- Despite a growth in Revenue, both companies recorded a moderation in profits reflecting the appreciation of the exchange rate
- The Sector pursued geographical diversification while Mabroc’s Kenyan subsidiary which completed its first full year of operations demonstrated encouraging results
Key developments
Revenue (Rs. bn)
Rs.12.85PBT (Rs. mn)
(524)PAT (Rs. mn)
(520)Assets (Rs. bn)
20.76Way forward priorities
- Performance impacted by appreciation in Sri Lankan Rupee and escalation in raw material costs, which led to a reduction in Revenue and implications on margins
- Investments in backward integration through investments in a fibre-extraction facility
- Continued investments in value-added products
Revenue (Rs.bn)
46.35PBT (Rs. mn)
3.86PAT (Rs.mn)
3.26Assets (Rs.bn)
42.04Way forward priorities
- Resilient performance backed up volume growth and penetration in new and existing markets
- Expansion of manufacturing footprint with the acquisition of Hi-Care Thai Gloves Co., Ltd and manufacturing expansion of Hanwella facility
- Strengthening global presence through establishing marketing arms
Revenue (Rs. bn)
42.83PBT (Rs. bn)
5.50PAT (Rs. bn)
4.26Assets (Rs. bn)
42.93Way forward priorities
- Revenue remained relatively unchanged due to the appreciation of the Sri Lankan Rupee, while Profit Before Tax moderated mainly due to margin contraction from rising coconut-shell charcoal prices in global markets
- The Sector continued to pursue increased contributions from value-added products and geographical expansion
- Strategic emphasis on strengthening supply chain security and resilience through backward integration and diversification of supply chains
Revenue (Rs. mn)
43.46PBT (Rs. bn)
3.07PAT (Rs. bn)
2.11Assets (Rs. bn)
35.86Way forward priorities
- Performance impacted by decline in volumes stemming from the deferment of orders from a major customer and appreciation of the Sri Lankan Rupee
- Strategic emphasis on brand diversification with the addition of several exciting, fast-growing brands to the portfolio
- Ongoing focus on transitioning from basic, conventional, cotton-based fabrics to premium, value-added products
Revenue (Rs. bn)
13.11PBT (Rs. bn)
1.14PAT (Rs. mn)
867Assets (Rs. bn)
16.56Way forward priorities
- Performance upheld by uptick in residential demand and strong growth in export volumes
- Strengthened manufacturing footprint with the commissioning of Ascend- an advanced facility featuring cutting-edge technology and invested in improving technological capabilities
- Successfully obtained the Aluminium Stewardship Initiative (ASI) certification
Revenue (Rs. bn)
19.18PBT (Rs. bn)
2.91PAT (Rs. bn)
1.91Assets (Rs. bn)
27.28Way forward priorities
- While Revenue increased led by growth in crops and prices, profitability was impacted by the sharp increase in wages and other costs
- Talawakelle Tea Estates commissioned a state-of-the art tea factory in Kiruwanaganga
- The three RPCs continue to lead the industry in sustainability, innovation and quality, emerging as top price takers in the Colombo Tea Auction.
Revenue (Rs. bn)
37.51PBT (Rs. bn)
2.60PAT (Rs. bn)
1.5Assets (Rs. bn)
29.33Way forward priorities
- The Sector delivered a resilient performance, through leveraging the diversity of its businesses geographical footprint and global partnerships.
- Continued focus on expanding product offering in Bangladesh
- Diversification of business lines with the entry into frozen coconut water
Revenue (Rs. bn)
108.48PBT (Rs. bn)
6.53PAT (Rs. bn)
4.39Assets (Rs. bn)
124.47Way forward priorities
- Singer achieved record-breaking profitability during the year supported by the more conducive market conditions and timely market activations across its network
- Widened the product and brand portfolio while pursuing diversification of customer segments
- Ongoing focus on upgrading showrooms and enhancing the customer experience
Revenue (Rs. bn)
9.65PBT (Rs. mn)
(521)PAT (Rs. mn)
(627)Assets (Rs. bn)
19.78Way forward priorities
- Sector’s overall performance was upheld by the record-breaking profitability of the Sri Lankan properties, with all four properties generating profits for the first time. Overall profitability however, continued to be impacted by Amaya Kuda Rah Maldives,
Revenue (Rs. bn)
11.10PBT (Rs. bn)
2.16PAT (Rs. bn)
1.71Assets (Rs.bn)
17.05Way forward priorities
- Sector delivered commendable performance during the year, reflecting improved profitability in both Industry Inputs and Power & Energy clusters
- Secured a tender to construct and operate a 4MW ground-mounted solar project
- Industrial Raw Materials performed well during the year, reflecting increased contributions from value-added products.
Revenue (Rs. bn)
106.84PBT (Rs. bn)
6.51PAT (Rs. bn)
3.72Assets (Rs. bn)
82.42Way forward priorities
- The Sector recorded significant improvements in Revenue and Profitability supported by more conducive conditions and broad-based improvements across clusters
- Strategic focus on establishing the geo-product organisational structure for focused regional expansion
- Expansion of the marine fleet with the addition of 3 vessels during the year
Revenue (Rs. bn)
26.62PBT (Rs. bn)
3.33PAT (Rs. bn)
2.37Assets (Rs. bn)
27.38Way forward priorities
- The Sector’s overall performance moderated due to the global decline in solar panel prices, although the Sector maintained its leadership position in solar EPC segment
- Secured a contract to develop a 50 MW wind power plant in Mannar, along with 37 ground-mounted solar projects amounting to 149 MWM
- Partnered with BYD, the global leader in Battery Energy Storage systems, to launch advanced energy storage and inverter solutions in Sri Lanka
Revenue (Rs.bn)
13.16PBT (Rs. mn)
616PAT (Rs.mn)
468Assets (Rs.bn)
5.59Way forward priorities
- Despite a growth in Revenue, both companies recorded a moderation in profits reflecting the appreciation of the exchange rate
- The Sector pursued geographical diversification while Mabroc’s Kenyan subsidiary which completed its first full year of operations demonstrated encouraging results
Risks and Opportunities
Economic
2025
92024
9- Reduce dependency on domestic market through expanding export-orientation
- Maintain strong relationships with stakeholders, lobby groups and banks
Liquidity and financial stability
2025
92024
9- Improve liquidity risk oversight by Board and GMC
- Derive Group synergies to manage borrowings
- Diversify funding sources
Geopolitical risk
2025
62024
4- Pursuing increased diversification of export markets, particularly in non-traditional markets
- Focused growth in selected markets
- Value-added product propositions which are relatively price
Data protection and cybersecurity risks
2025
62024
6- IT governance policies and structures in place
- Regular employee awareness on mitigating cybersecurity risks
- Robust Business Continuity Plan in place
Physical risks of climate change
2025
62024
6- Close monitoring of weather patterns and potential impacts
- Climate adaptation measures
- Strengthen environmental management systems through certifications
Transitional risks of climate change
2025
62024
6- Close engagement with customers on identifying and responding to sustainability-related demands
- Gradual transition to renewable energy sources
- Environmental targets centered on emission reductions, water consumption and waste management
Risk
Risk Rating
2024
92025
9Mitigation
- Reduce dependency on domestic market through expanding export-orientation
- Maintain strong relationships with stakeholders, lobby groups and banks
Risk Rating
2024
92025
9Mitigation
- Improve liquidity risk oversight by Board and GMC
- Derive Group synergies to manage borrowings
- Diversify funding sources
Risk Rating
2024
42025
6Mitigation
- Pursuing increased diversification of export markets, particularly in non-traditional markets
- Focused growth in selected markets
- Value-added product propositions which are relatively price
Risk Rating
2024
62025
6Mitigation
- IT governance policies and structures in place
- Regular employee awareness on mitigating cybersecurity risks
- Robust Business Continuity Plan in place
Risk Rating
2024
62025
6Mitigation
- Close monitoring of weather patterns and potential impacts
- Climate adaptation measures
- Strengthen environmental management systems through certifications
Risk Rating
2024
62025
6Mitigation
- Close engagement with customers on identifying and responding to sustainability-related demands
- Gradual transition to renewable energy sources
- Environmental targets centered on emission reductions, water consumption and waste management
Way Forward
Portfolio Optimisation
- Export-oriented sectors will seek to diversify its markets with increasing focus on non-traditional markets
- Increase contributions from value-added products, thereby reducing exposure to price competitive offerings
- Pursuing diversification of funding sources Optimising working capital with the aim of reducing inventory-build up
Customer Centricity
- Focus on customised solutions to sharpen competitive edge and customer loyalty
- Active engagement in trade fairs and exhibitions
- Aggressively seeking new customer acquisition in regional markets
Inclusive business models
- Continued focus on prioritising inclusive supply chains which accelerate positive social and environmental impact
- Screening suppliers on environmental and social criteria
Customer Centricity
- Succession planning across sectors to build effective talent pipelines
- Creating a respectful and inclusive workplace through ongoing training and engagement interventions
- Ongoing investments in training and development
ESG integration
- Completion of Sector-level ESG roadmaps across all Sectors
- Ongoing focus on strengthening ESG governance and reporting mechanisms
- Initiatives across all six pillars aligned to the aspirations of the Hayleys Lifecode